
What is the real numbers of CoVid 19 deaths?
COVID doctors challenge CDC’s rules on cause of death, concerned about inflated numbers https://justthenews.com/politics-policy/coronavirus/doctors-and-clinical-researchers-challenge-uns-who-cdc-and-dr-faucis
Does CoVid 19 really exist?
Creating the illusion of a pandemic through diagnostic tests. https://www.lewrockwell.com/2020/04/jon-rappoport/corona-creating-the-illusion-of-a-pandemic-through-diagnostic-tests/
While no one knows what the real number of deaths caused by CoVid 19 truly are . . . Let’s go back in time to get a more realistic picture of our current situation. Let’s compare an average four-month timeline from 2017 of deaths from all causes and compare it with the total deaths from all causes from February 1, 2020 – May 19, 2020.
Four-month average of actual total deaths compared with a four-month expected average of total deaths in 2017: Click the state, go through weeks 1 to 16, and then get the “Total Deaths” from the bottom right.
Florida: 199,385 yearly deaths (2015-18) expected average for 4 months = 66,462
http://www.flpublichealth.com/VSBOOK/pdf/2018/vscomp.pdf
Georgia: 83,098 yearly deaths (2017) expected average for 4 months = 27,699
https://www.statista.com/statistics/241581/births-and-deaths-in-the-us-by-state/
Illinois: 108,414 yearly deaths (2015-18) expected average for 4 months = 36,138
https://dph.illinois.gov/data-statistics/vital-statistics/death-statistics
Massachusetts: 57,185 yearly deaths (2014-17) expected average for 4 months = 19,062
https://www.mass.gov/lists/death-data
Michigan: 96,919 yearly deaths (2015-18) expected average for 4 months = 32,306
https://www.mdch.state.mi.us/pha/osr/deaths/causRScnty.asp
New Jersey: 74,057 yearly deaths (2015-2018) expected average for 4 months = 24,686
https://www-doh.state.nj.us/doh-shad/query/result/mort/MortStateICD10/Count.html
New York: 150,959 yearly deaths (2013-16) expected average for 4 months = 50,319
https://apps.health.ny.gov/public/tabvis/PHIG_Public/lcd/reports/#state
Oregon: 36,085 yearly deaths (2015-18) expected average for 4 months = 12,028
https://www.oregon.gov/oha/PH/BIRTHDEATHCERTIFICATES/VITALSTATISTICS/ANNUALREPORTS/VOLUME2/Pages/index.aspx
Pennsylvania: 132,088 yearly deaths (2014-17) expected average for 4 months = 44,029
https://www.health.pa.gov/topics/HealthStatistics/VitalStatistics/DeathStatistics/Documents/Death_AgeSexRaceYear_PA_2013_2017.pdf
Texas: 181,226 yearly deaths (2012-15) expected average for 4 months = 60,408
https://dshs.texas.gov/chs/vstat/annrpts.shtm
Washington: 55,796 yearly deaths (2015-18) expected average for 4 months = 19,599
https://www.doh.wa.gov/Portals/1/Documents/Pubs/422-099-2018-2010-VitalStatHighlights.pdf
Interestingly New York was 11,000 BELOW its expected and New Jersey was 8,000 ABOVE.
Florida: Expected 66,462 / Actual 68,427
Georgia: Expected 27,699 / Actual 27,161
Illinois: Expected 36,138 / Actual 37,870
Massachusetts: Expected 19,062 / Actual 21,800
Michigan: Expected 32,306 / Actual 35,598
New Jersey: Expected 24,686 / Actual 32,600
New York: Expected 50,319 / Actual 39,005
Oregon: Expected 12,028 / Actual 11,834
Pennsylvania: Expected 44,029 / Actual 37,383
Texas: Expected 60,408 / Actual 66,071
Washington: Expected 19,599 / Actual 19,270
Total: Expected 392,736 / Actual 397,019
Entire USA: Expected 937,834 / Actual 961,230
Entire USA: 2,813,503 yearly deaths (2017) average for 4 months = 937,834
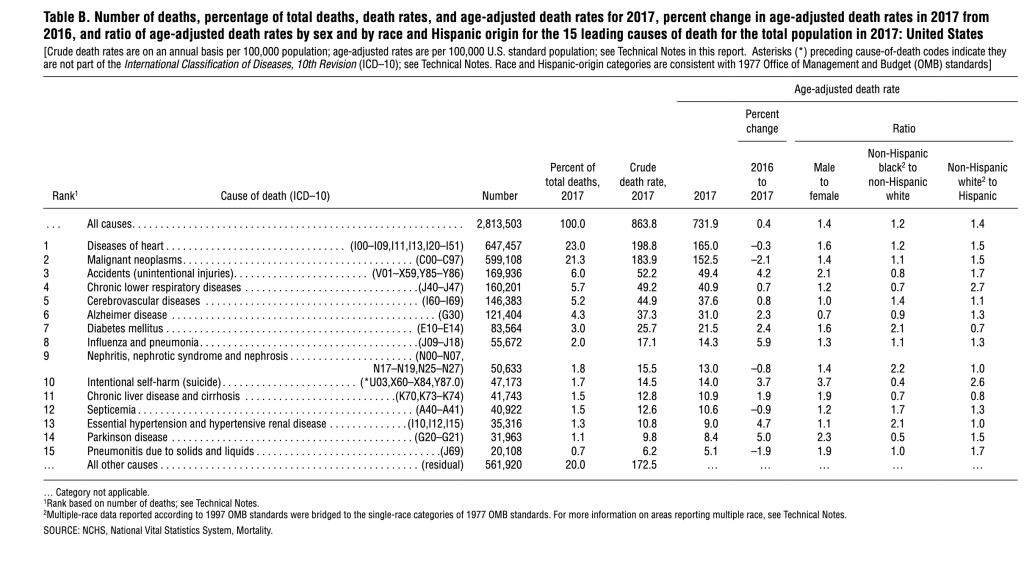
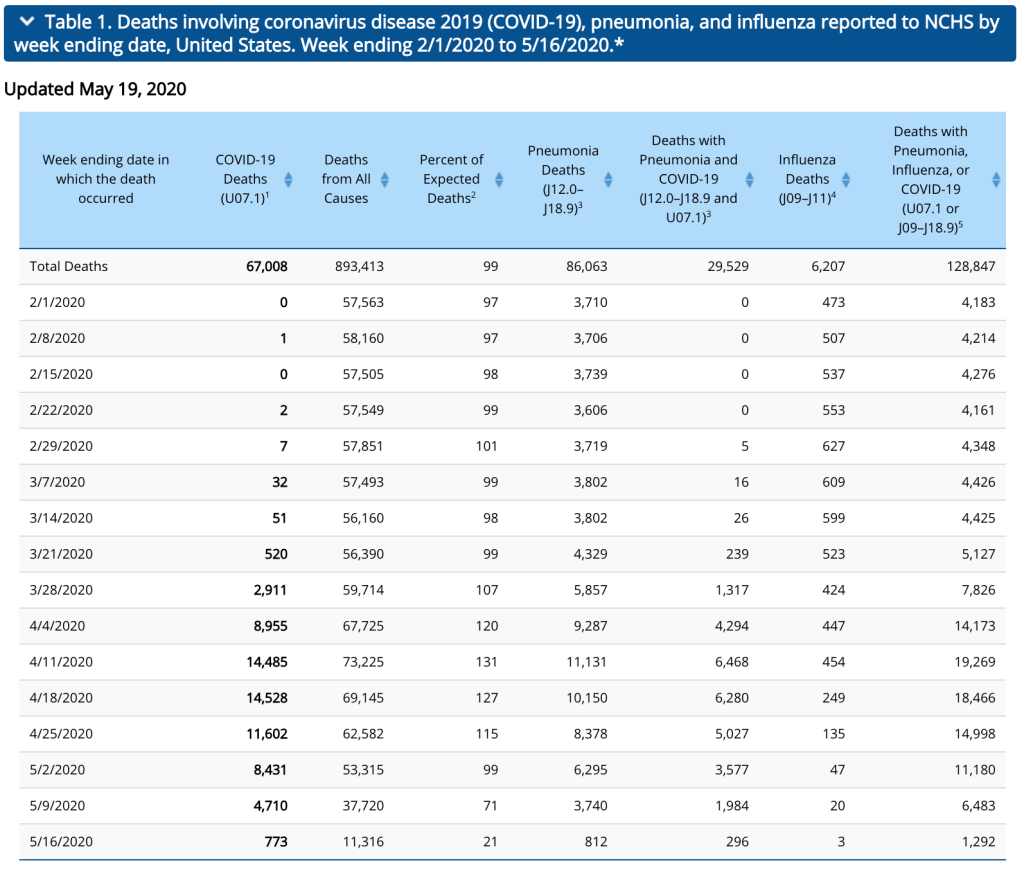
Table 1. Deaths involving coronavirus disease 2019 (COVID-19), pneumonia, and influenza reported to NCHS by week ending date, United States. Also includes total deaths from all causes. Week ending 2/1/2020 to 5/19/2020.
https://www.cdc.gov/nchs/nvss/vsrr/COVID19/index.htm
Let’s do some quick calculations . . .
May has 31 days. Today is May 19, so there is 12 days left for this month.
As of May19, 2020 with 12 days left in the month the total amount of all deaths since February 1, 2020 is 893,413
The total average deaths for a four-month period in 2017 was 937,834
937,834 – 893,413 = 44,421
So, if 44,421 people pass away in the next two weeks, the total four-month average for this year (2020) will be the same as the total average deaths for a four-month time period from 2017.
Reminder: In 2017, CoVid 19 did not exist.
I will compare this again on June 1, 2020.
Update as of May 26, 2020
937,834 – 928,220 = 9,614 less deaths from all causes as of May 26, 2020 https://www.cdc.gov/nchs/nvss/vsrr/covid19/index.htm
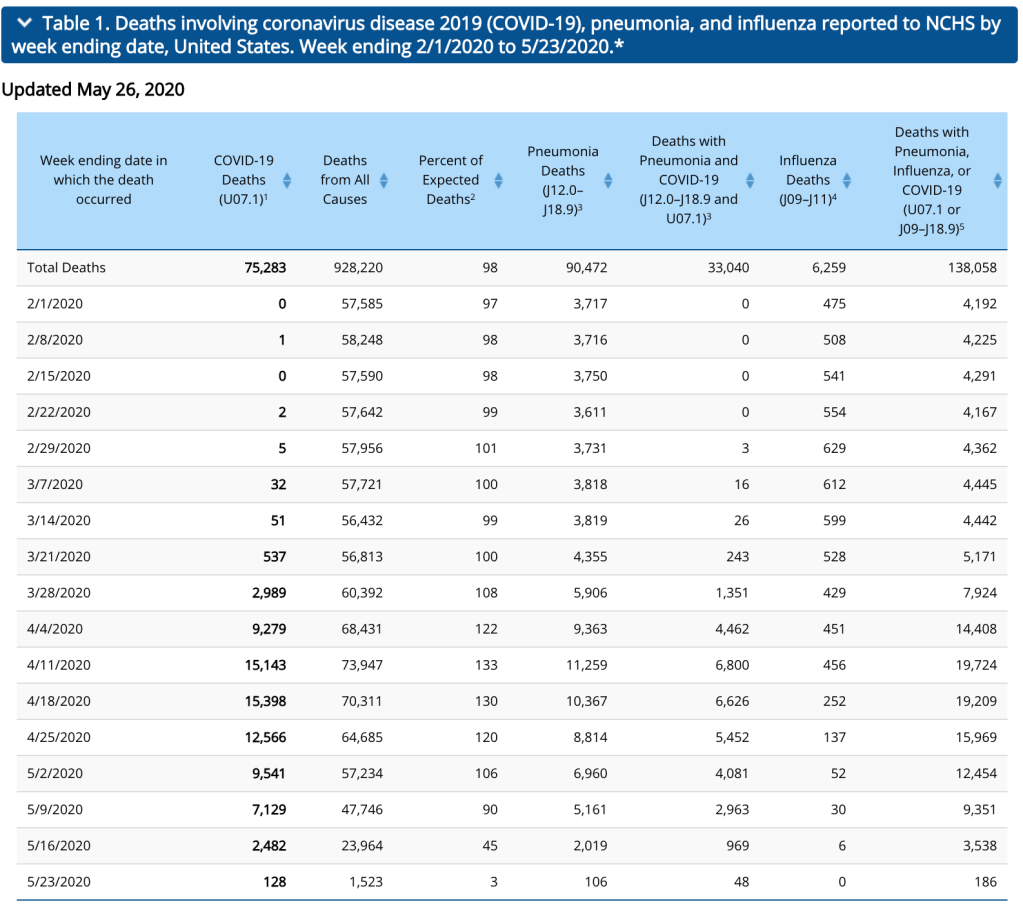
I am guessing that we will have about 24,862 more overall deaths by May 31, 2020. If I am correct this will more than likely be the correct number of CoVid deaths for the four month period of February 1, 2010 – June 1, 2020.
How did I get this number?
44,421 – 9,614 = 34,807 have died from all causes in the last 7 days.
So, let’s divide 34,807/7 = 4,972 a day.
Now, Let’s take 4,972 x 5 days that are left in May and we get (24,862).
Let’s see how close I get?
Final Update: June 1, 2020 – Okay, So let’s see the total four month total.
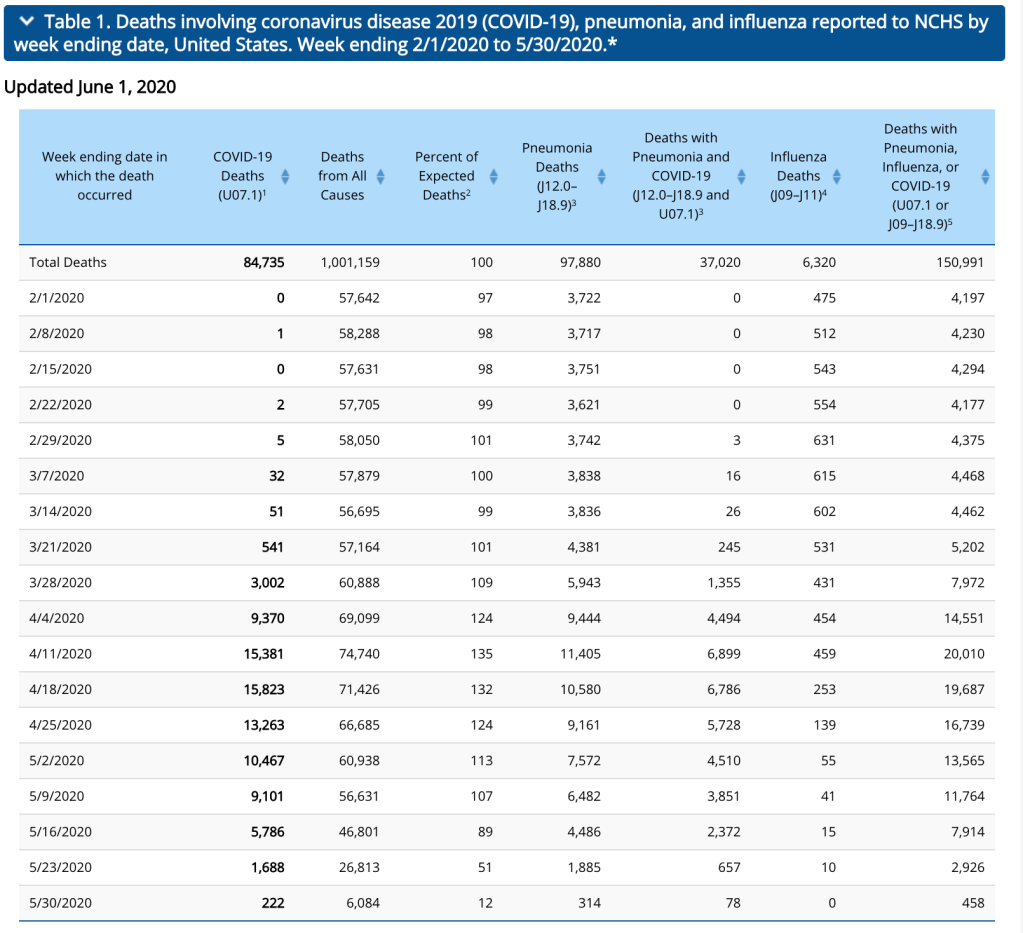
Total four month total of deaths from all causes from Feb 1, 2020 through June 1, 2020 – – 1,001,159
Total four month total of deaths from all causes from 2017 – – 937,834
1,001,159 – 937,834 = 63,325 more deaths in 2020 compared to 2017.
I predicted 24,862, so I was off by 38,463, or was I?
Okay, so now let’s look at how many deaths were in nursing homes . . .
How to Track COVID-19 Nursing Home Cases and Deaths in Your State
What states are reporting and how to find it
by Emily Paulin, AARP, Updated June 1, 2020 https://www.aarp.org/caregiving/health/info-2020/coronavirus-nursing-home-cases-deaths.html
“More than 38,000 nursing home residents and staff have died from COVID-19, representing over a third of the nation’s known coronavirus deaths. While dire, this figure is an undercount, experts warn, because not all states are publicly reporting data yet. In many states, more than half of coronavirus deaths have come in nursing homes.
Although each state is required to report confirmed COVID-19 cases and deaths in nursing homes to the Centers for Disease Control and Prevention (CDC) — and individual facilities are required to report that information to residents and their families — they are not required to share it publicly. Some states are therefore choosing not to. And while the federal government announced it would share each state’s data with the public, it’s not doing so yet.”
Using my calculations above this year’s Corona Virus – CoVid 19 season total deaths are on par with the 2017-2018 season, when 61,000 deaths were linked to the flu virus. However, it does surpass the 2018-2019 season’s 34,200 flu-related deaths.
Conclusion: The hype given to Covid-19 was unjustified and has now been proven to have caused way more damage than the actual virus itself.

Hi Sarah,
I enjoy reading your post and learning the ways of the world.
Thank you
LikeLike
Hi great reading yourr post
LikeLike